Navigating the Portal
The Cancer Complexity Knowledge Portal is designed to highlight and support navigation to different types of data and related information and resources emerging from CSBC and PS-ON activities. The main purpose of the portal is for you to explore data and resources, but there are many ways to arrive at your information of interest. Let’s go through the different portal components so you can use the site to best suit your needs. Some of the sections below have labelled screenshots to help explain.
Portal structure
Before learning how to successfully navigate the site and access your data of interest, you should become familiar with some of the common terms used to categorize portal resources and how they fit with one another.
The core of the portal is the Explore tab, which you can access along the top menu. This is where you can explore and download data, publications, and other resources.

The Explore tab contains six subtabs, which represent the different categories by which you can explore information in the portal: Grants, People, Publications, Datasets, Files, and Tools.
Learn more about the Explore tab below, including how each of these categories are define in the portal, and how to access what you need from each one.
Home
The homepage is broken into sections that offer different ways of arriving at resources of interest for you to browse. Below is a breakdown of some of these sections:
Portal goals
This section provides direct links to explore resources by Grants, Data, Tools, and Publications. You can also arrive at these sections via the Explore tab along the top menu. Find more information on each of these resource pages lower down in this article.
What research themes are scientists currently focusing on?
This section provides a visualization of the different focus areas featured throughout the portal.
The top visualization offers a breakdown of grants, separated by consortia. You can hover over any of the colored blocks for an exact number of grants per consortia, as seen below. You can also click on any of the blocks to arrive directly at a filtered selection of grants associated with that consortium.
Then, the bar plots below offers a breakdown of research themes, in terms of volume by resource type (i.e. datasets, publications, and tools). Each of these data types is represented by an icon, as presented in the legend at the top. You can hover over any of these icons to see a detailed count, as seen below. You can also click on any of the icons to arrive directly at a filtered selection of that data type, for that theme. For example, if you click on the publications icon in the Drug Resistance/Sensitivity plot, you’ll be taken to all of the publications associated with that research theme.
The cancer resource information ecosystem
This section offers a comprehensive list of tools and resources for you to explore. Use the table of contents embedded on the left to browse, and click on any of the titles to access that resource.
Explore
The Explore section is where you can access the portal data and other resources. This data is organized into categories, represented by the subtabs under the Explore tab in the navigation menu. You can explore data by Grants, People, Publications, Datasets, Files, and Tools. More details on each of these categories is provided below, along with labelled screenshots to help orient you within each page.
These terms can have slightly different definitions depending on context (for example, other portals in the Sage network might define them differently). As resources related to or derived from CSBC and PS-ON consortia activities, here’s how these terms are defined in the Cancer Complexity Knowledge Portal:
Grants: Consortia (i.e. CSBC or PS-ON) grants, represented by a grant number, grant type, consortium, investigator(s), and theme(s).
People: Information on consortia members, including contact information, affiliation, and consortia activities.
Publications: Publications derived from consortia activity, associated with a specific grant (note: does not include pre-prints).
Datasets: Datasets derived from or relevant to consortia activity, associated with a specific publication and grant.
Files: Individual files associated with datasets, available for download.
Tools: Application software derived from consortia activity with well-defined processing functions (inputs, outputs, and operations), associated with a specific publication and grant.
Each of these Explore pages is displayed in the same way. You will find a Filter By section on the left (1), a visualization section on top (2), and a collection of data just below (3).
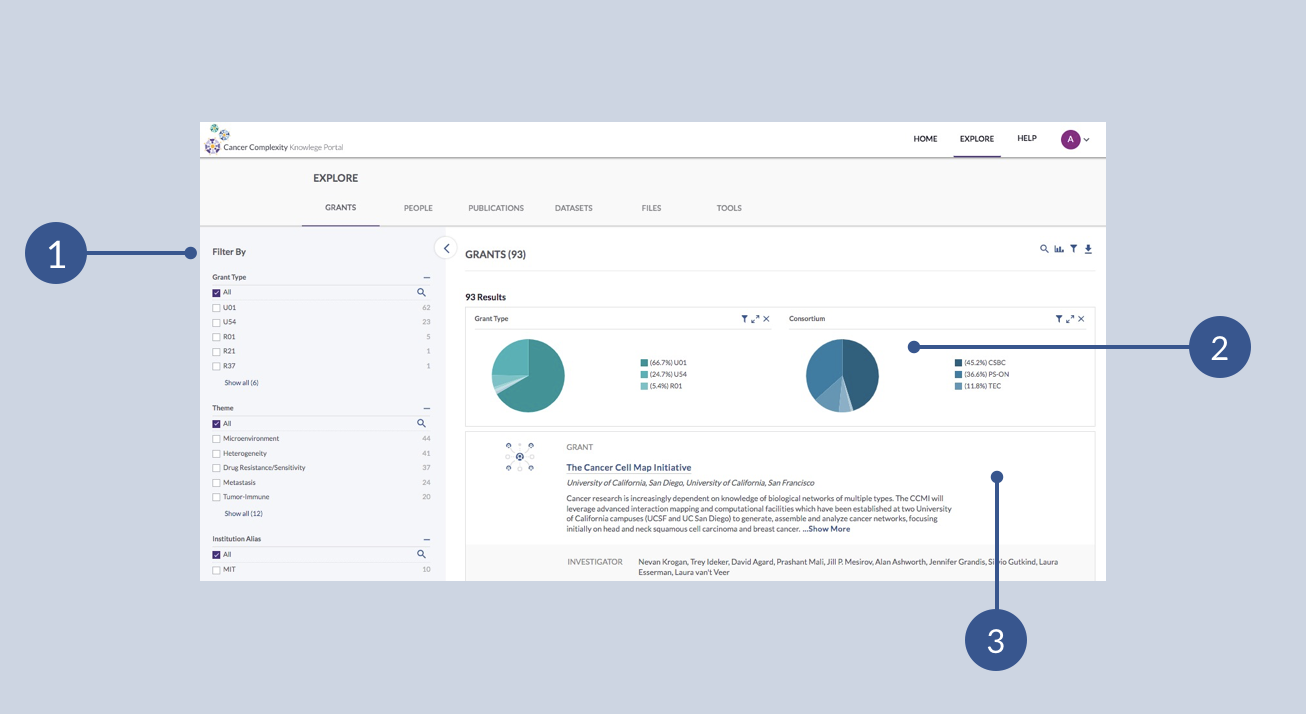
Learn how to use the filtering and visualization tools here: Exploring and Downloading Data.
Grants
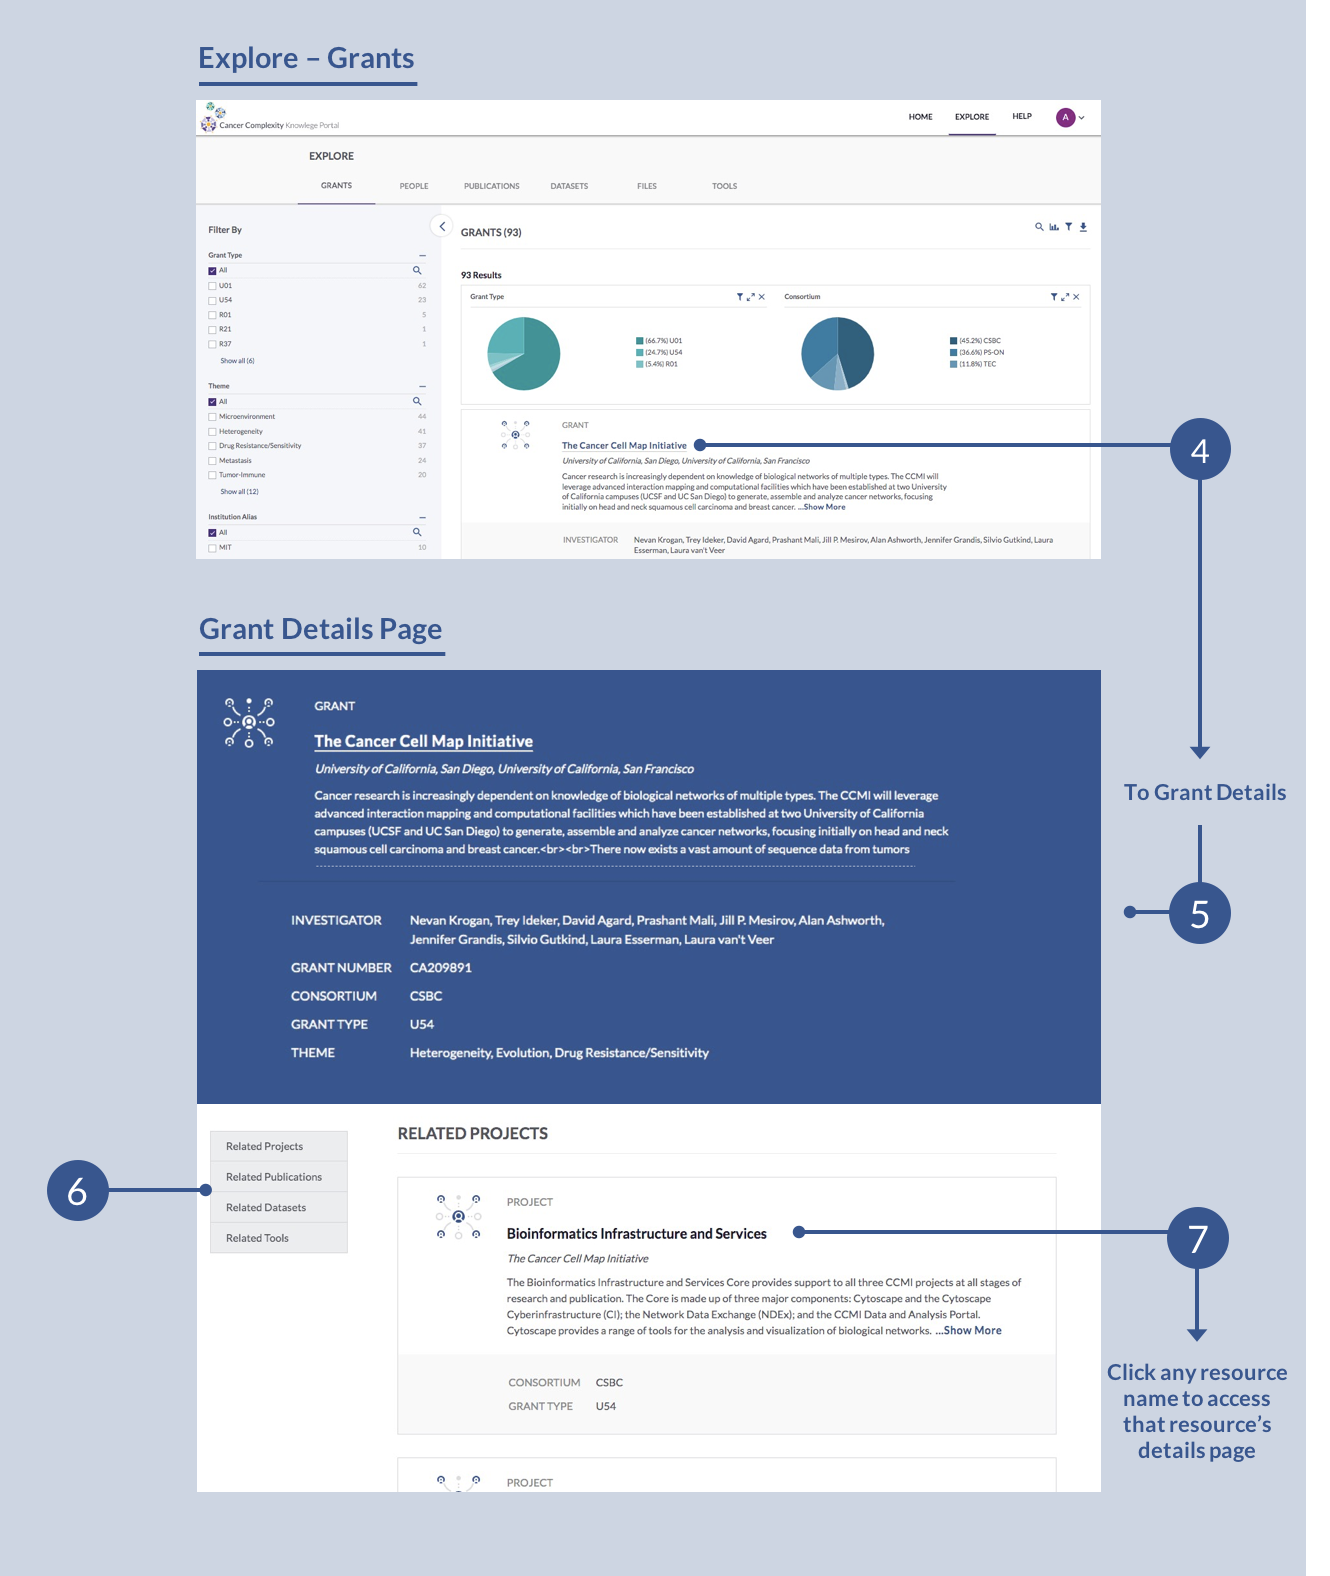
Use the Explore - Grants page to browse and query for the funding sources for data and resources found throughout the portal. Using the filtering tools on the left (1) or the visualization tools (2), you can generate a collection of grant cards that will appear under the visualizations. Click on the name of any grant on a Grant Card (4) to visit the corresponding Grant Details page (5). On this page, use the table of contents on the left (6) to scroll through and see the various Projects, Publications, Datasets, and Tools related to the grant. You can click the name of any of these related resources (7) to be brought to that specific resource’s page.
People
Use the Explore - People page to browse and query for the various people involved with consortium and grants found throughout the portal. Use the filtering tools on the left (1) or the visualization tools (2) to narrow down the list of people by grant number, consortium, or working group participation. Click on any person’s name to visit a details page that displays any of their related publications, datasets, or tools.
Publications
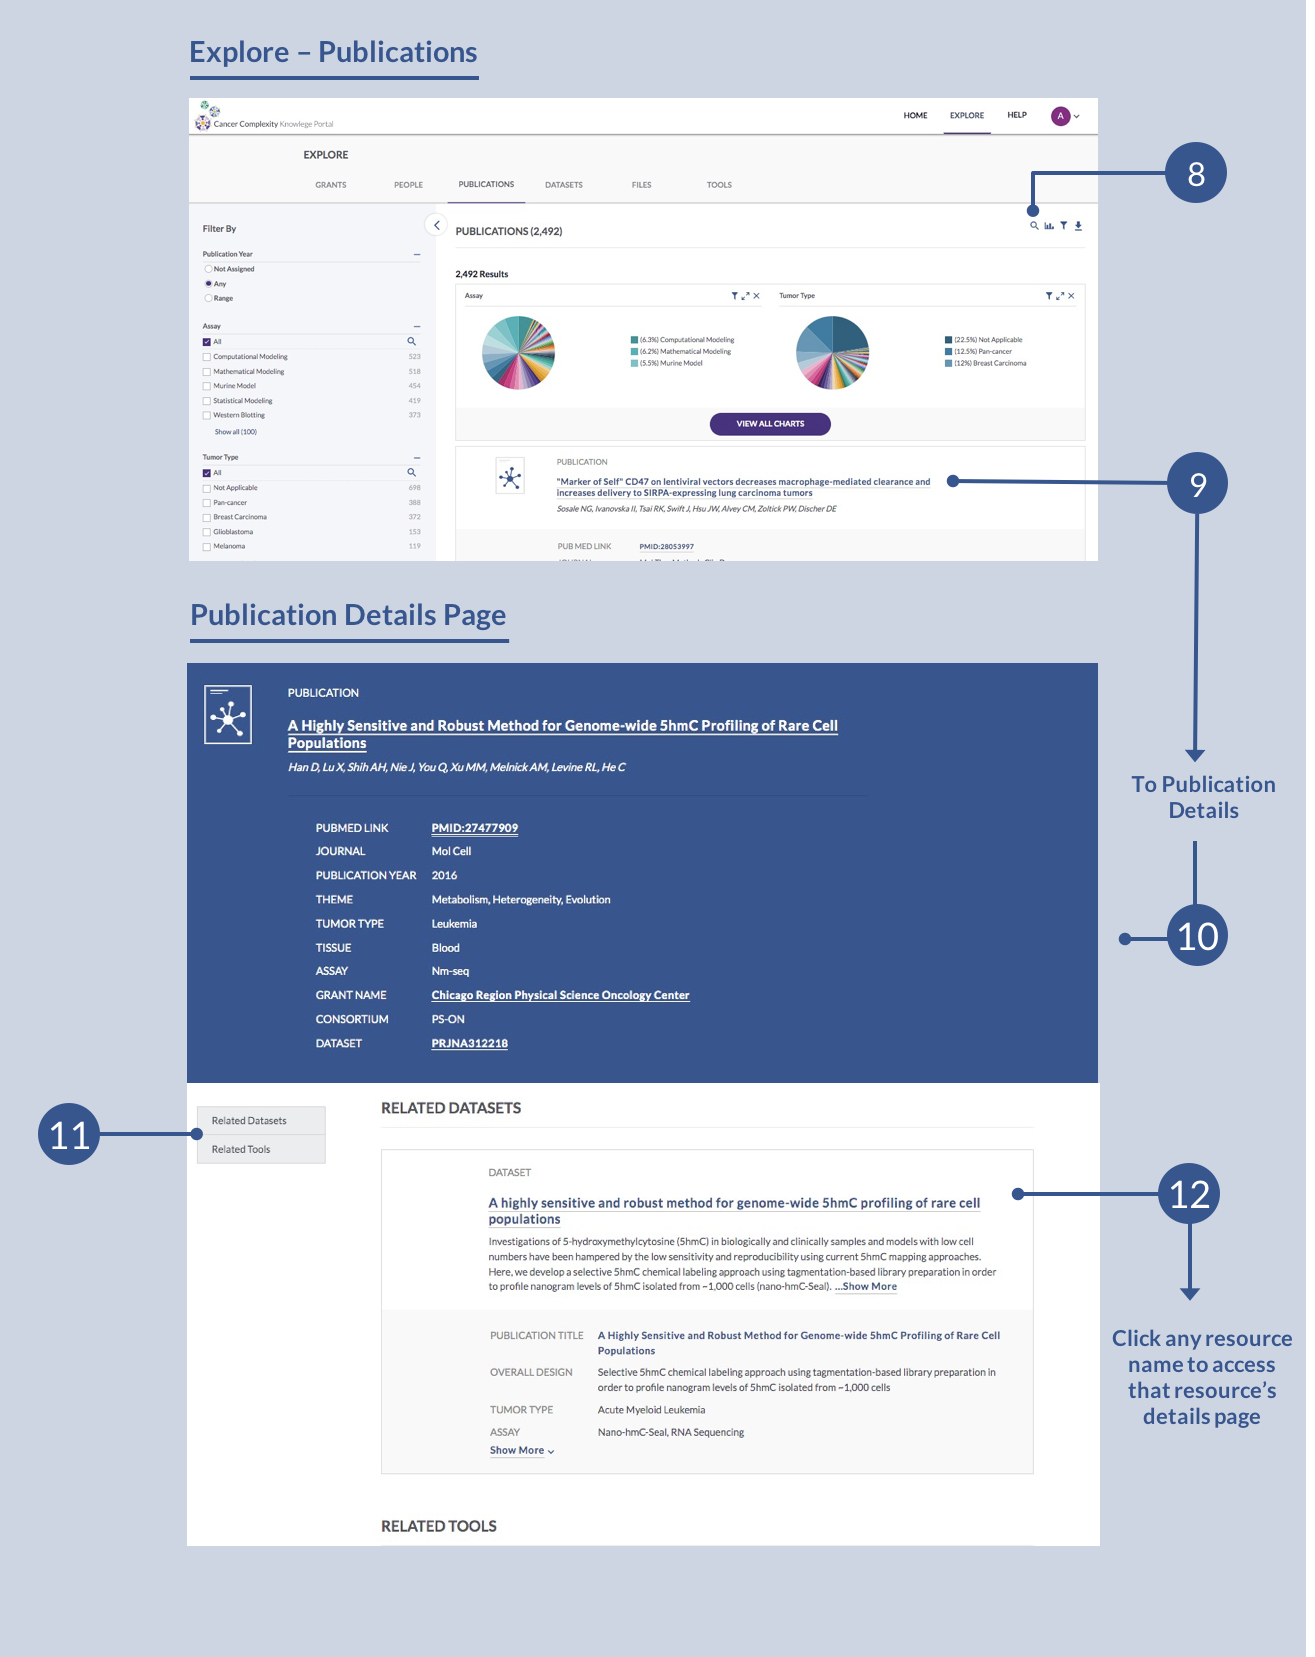
Publications are a core output from one or more studies. Using the filtering tools (1) or the visualization tools (2), you can browse and filter for relevant publications, or use the search tool (8) to search for a specific publication, by title, author, journal, or other facet. This will generate a collection of Publication Cards—click on any publication name (9) to visit the corresponding Publication Details page (10).
On this page, use the table of contents on the left (11) to see the various Datasets and Tools related to the publication. You can click the name of any of these related resources (12) to be brought to that specific resource’s page.
Datasets
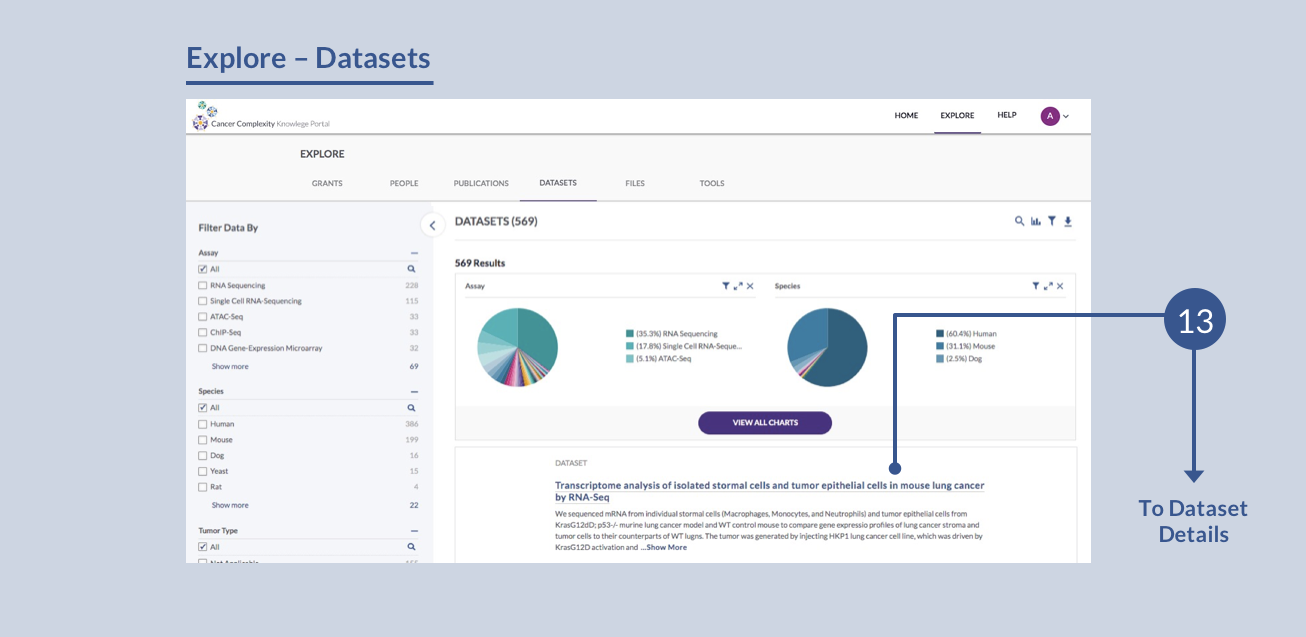
Explore the wide range of datasets resulting from a spectrum of indications and experimental conditions. Use the filtering tools (1) or the visualization tools (2) to filter by assay, species, tumor type, and much more, in any combination, or use the search tool (8) to find the dataset(s) you’re interested in.
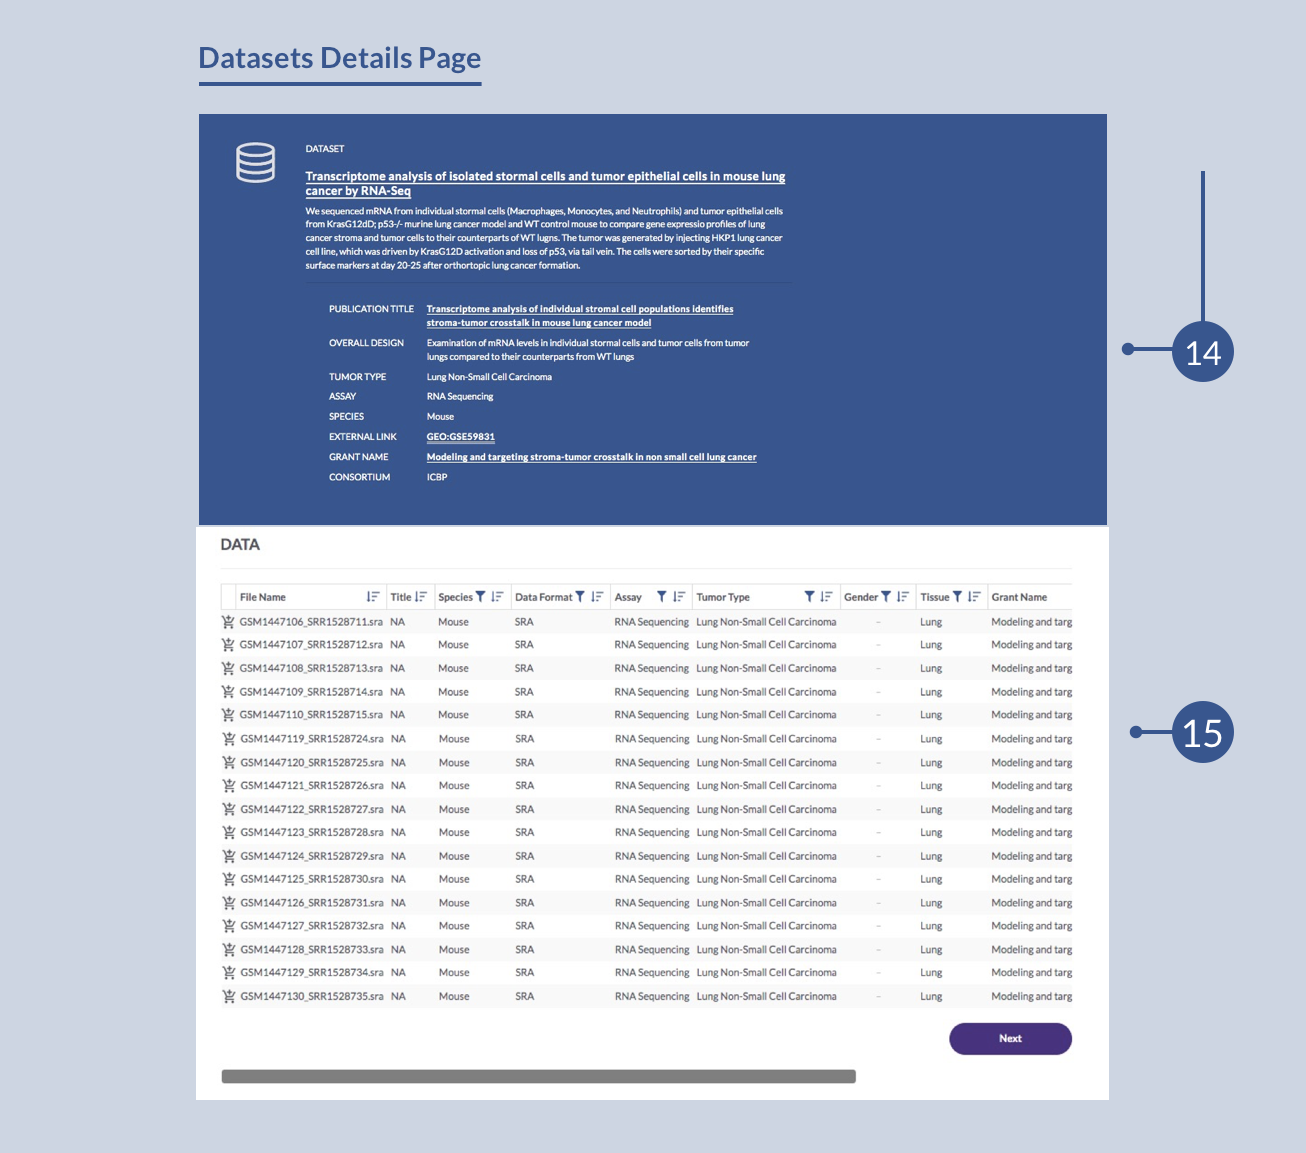
Your query will generate a collection of Dataset Cards—click on any dataset name (13) to visit the corresponding Dataset Details page (14).
This page will list relevant details of the dataset at the top, followed by a list of all the files included in that dataset (15). The actual files of these datasets are not stored in the portal—if you would like to view the individual files of a dataset, please contact sage-csbc-pson@sagebase.org and we’ll direct you to the external repository.
Files
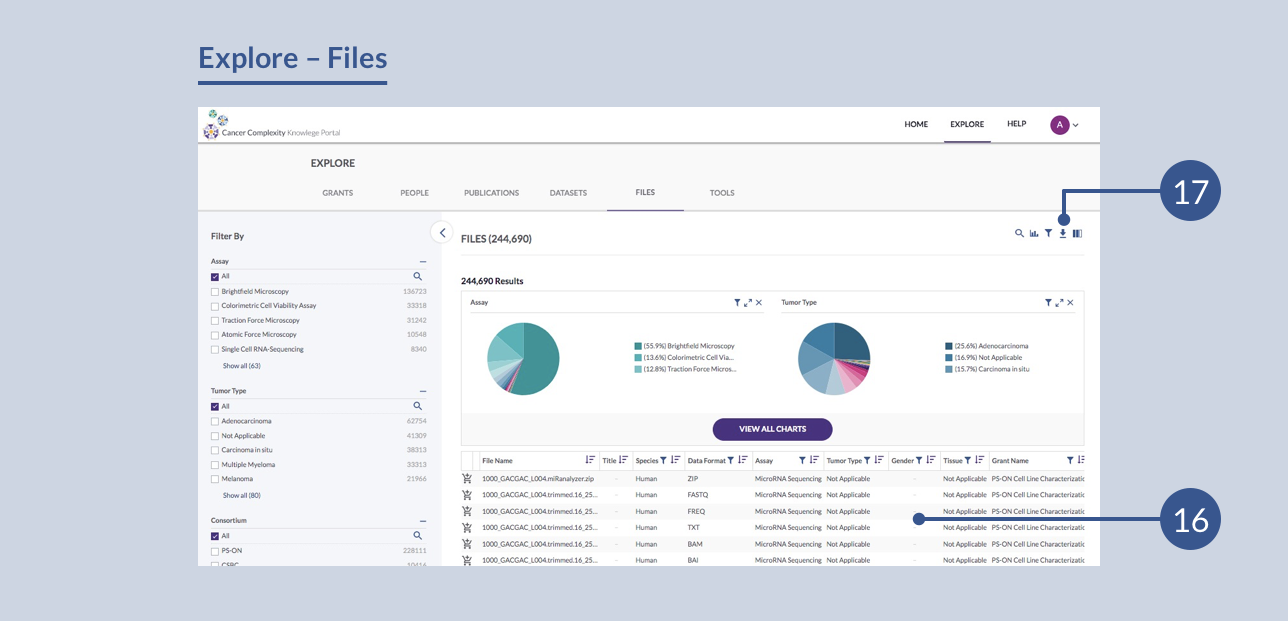
This section allows you to browse and download any subset of files. They can belong to different datasets, assays, consortiums, grants, and more. You can mix and match to download your own custom query of files, download individual files, or some combination of both.
Individual files don’t have a details page like the other data types. To make use of this section, you would use the filtering tools at the left (1) or the visualization tools (2) to create a custom query. The resulting file list will appear on the page (16). If you want to download the list of files, you would do so using the download icon (17).
You can find detailed instructions on downloading files here.
Tools
This section allows you to browse for data by methods used—the various software tools and algorithms, models, and applications employed to obtain results. The catalog of tools developed by investigators can be used to derive new insights from existing data.
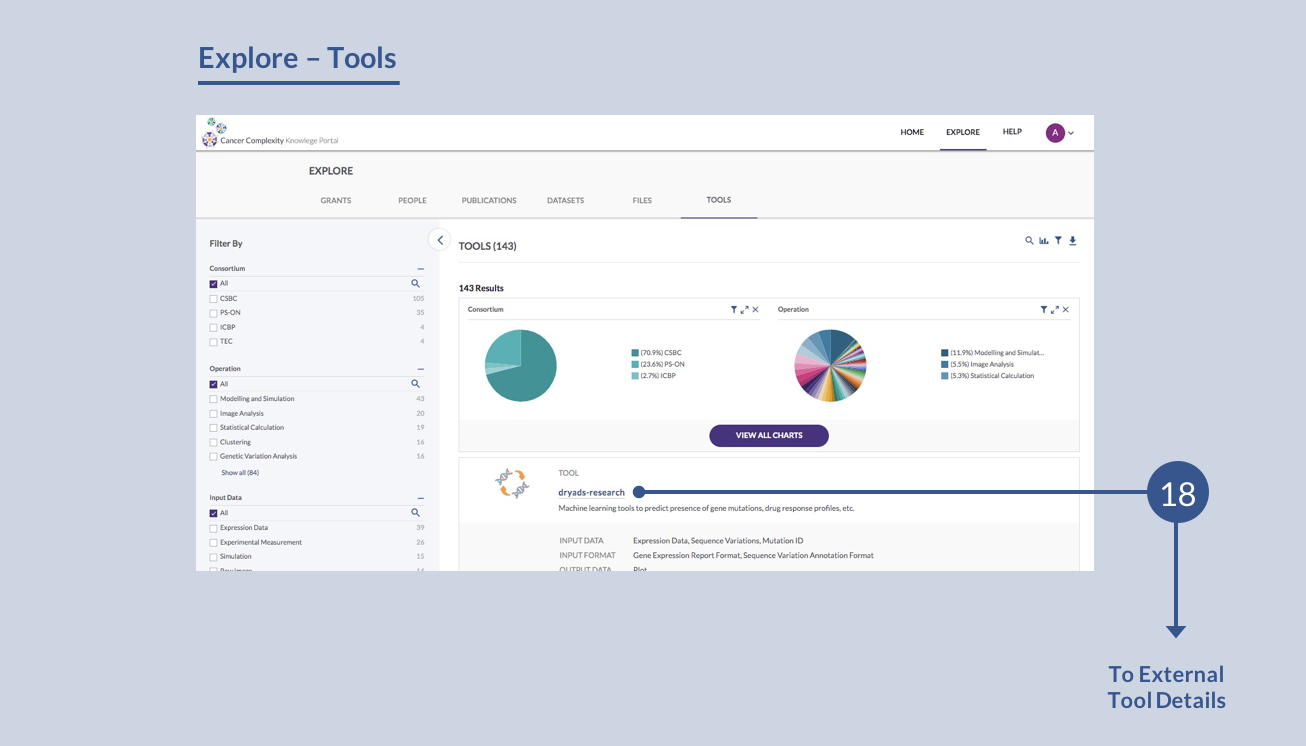
Use the filtering tools (1) or the visualization tools (2) to filter by consortium, operation, input/output data type and much more, in any combination, or use the search tool (8) to search by tool name, description, or more to find the tool(s) you’re interested in.
Your query will generate a collection of Tool Cards—click on any dataset name (18) to visit the corresponding external resource page for that tool. This external page may be in Github, or some other external host site.
Wondering how to use the filtering and visualization tools on each Explore page? See Exploring and Downloading Data for instructions.
Questions? Need additional help?
Please feel free to contact us by email at mc2center@sagebase.org.
