Use Search, Filters, and Charts
Within the Cancer Complexity Knowledge Portal (CCKP), the Explore Module provides three primary methods to find research resources:
These tools help users find relevant grants, datasets, publications, and research tools that match their specific focus.
Search
Follow these steps to search grants, datasets, publications, research tools and profiles:
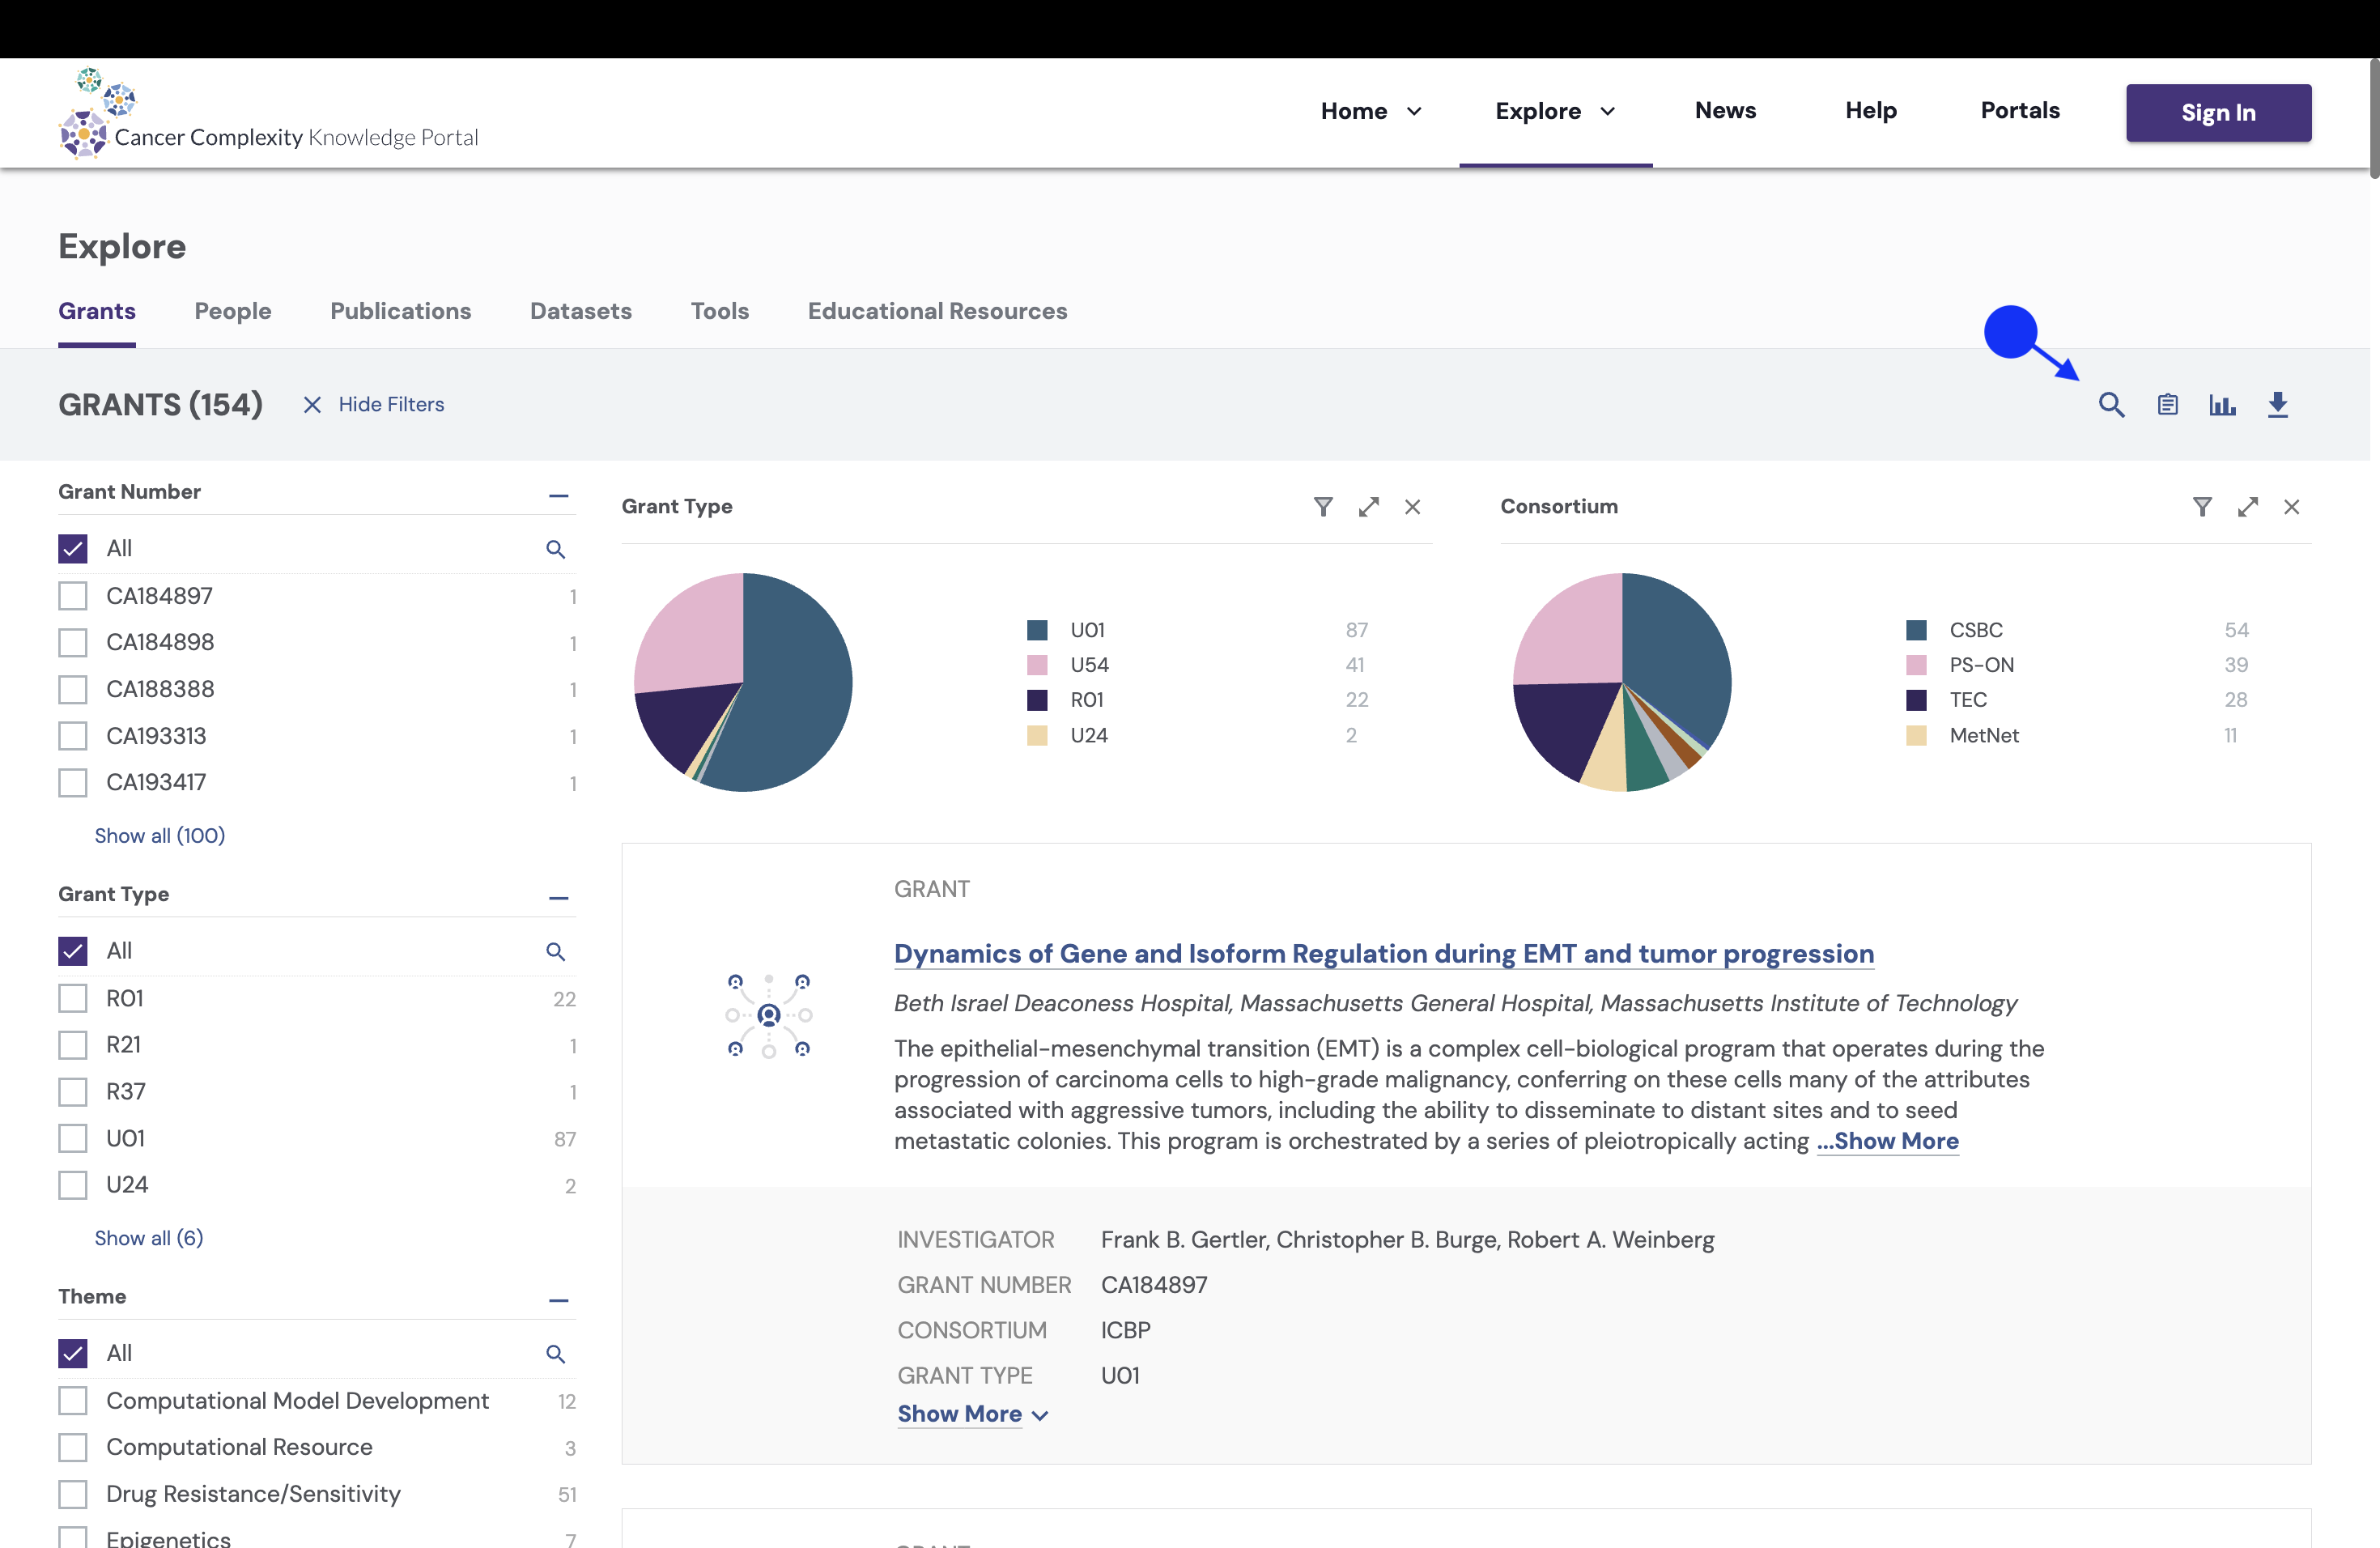
Step 1: Locate the Search Bar near the top-right, marked by a magnifying glass icon.

Step 2: Type a keyword relevant to your search.
a. The search filter is automatically applied.
b. Apply additional filters with new search terms. The system combines keywords to narrow the results.
c. To start a new search, remove the current filter by clicking the “X” next to it before entering a new query.
Step 3: Click on any result to open a detailed information page.
Filters
Filters narrow search results for grants, datasets, publications, tools, researchers, and educational resources based on specific criteria. Follow these steps to apply filters:
Accessing the Filter Panel
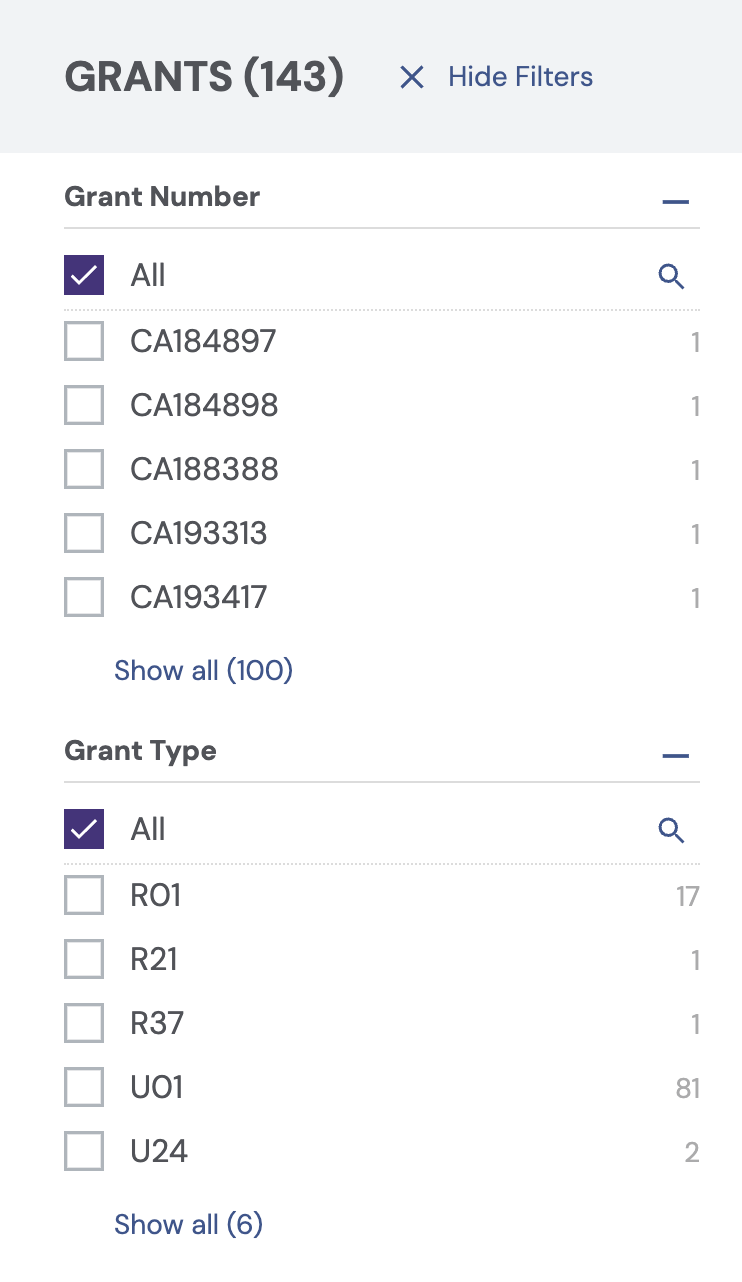
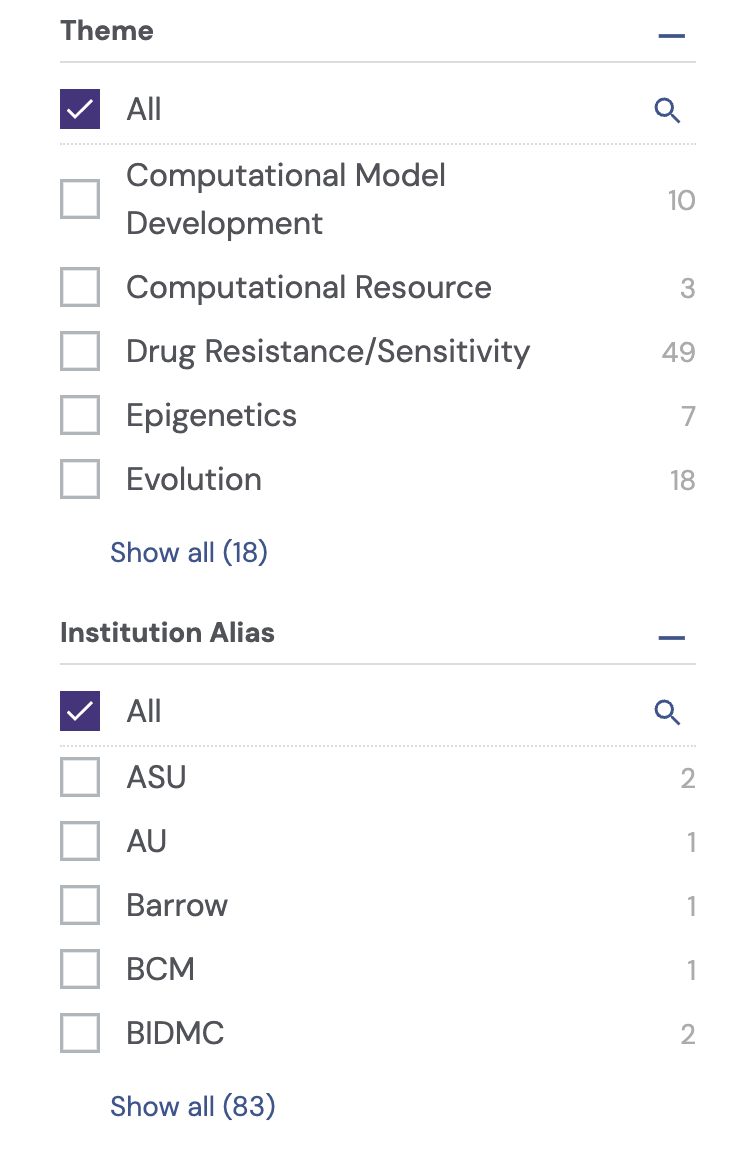
Locate the Filters Panel on the left side of the page.
Filters vary based on the selected category of resources (e.g., grants, datasets, tools, or publications).
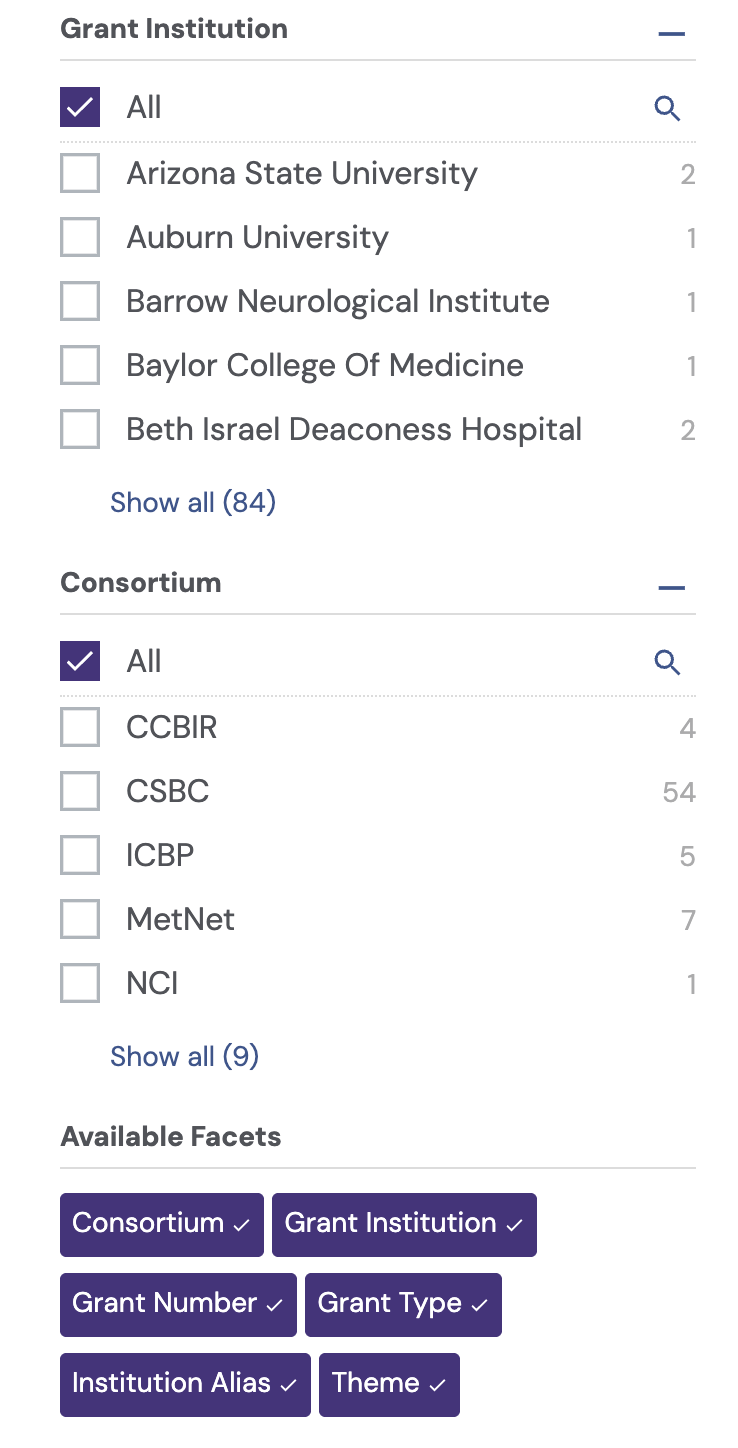
Applying a Filter
Click on a filter category.
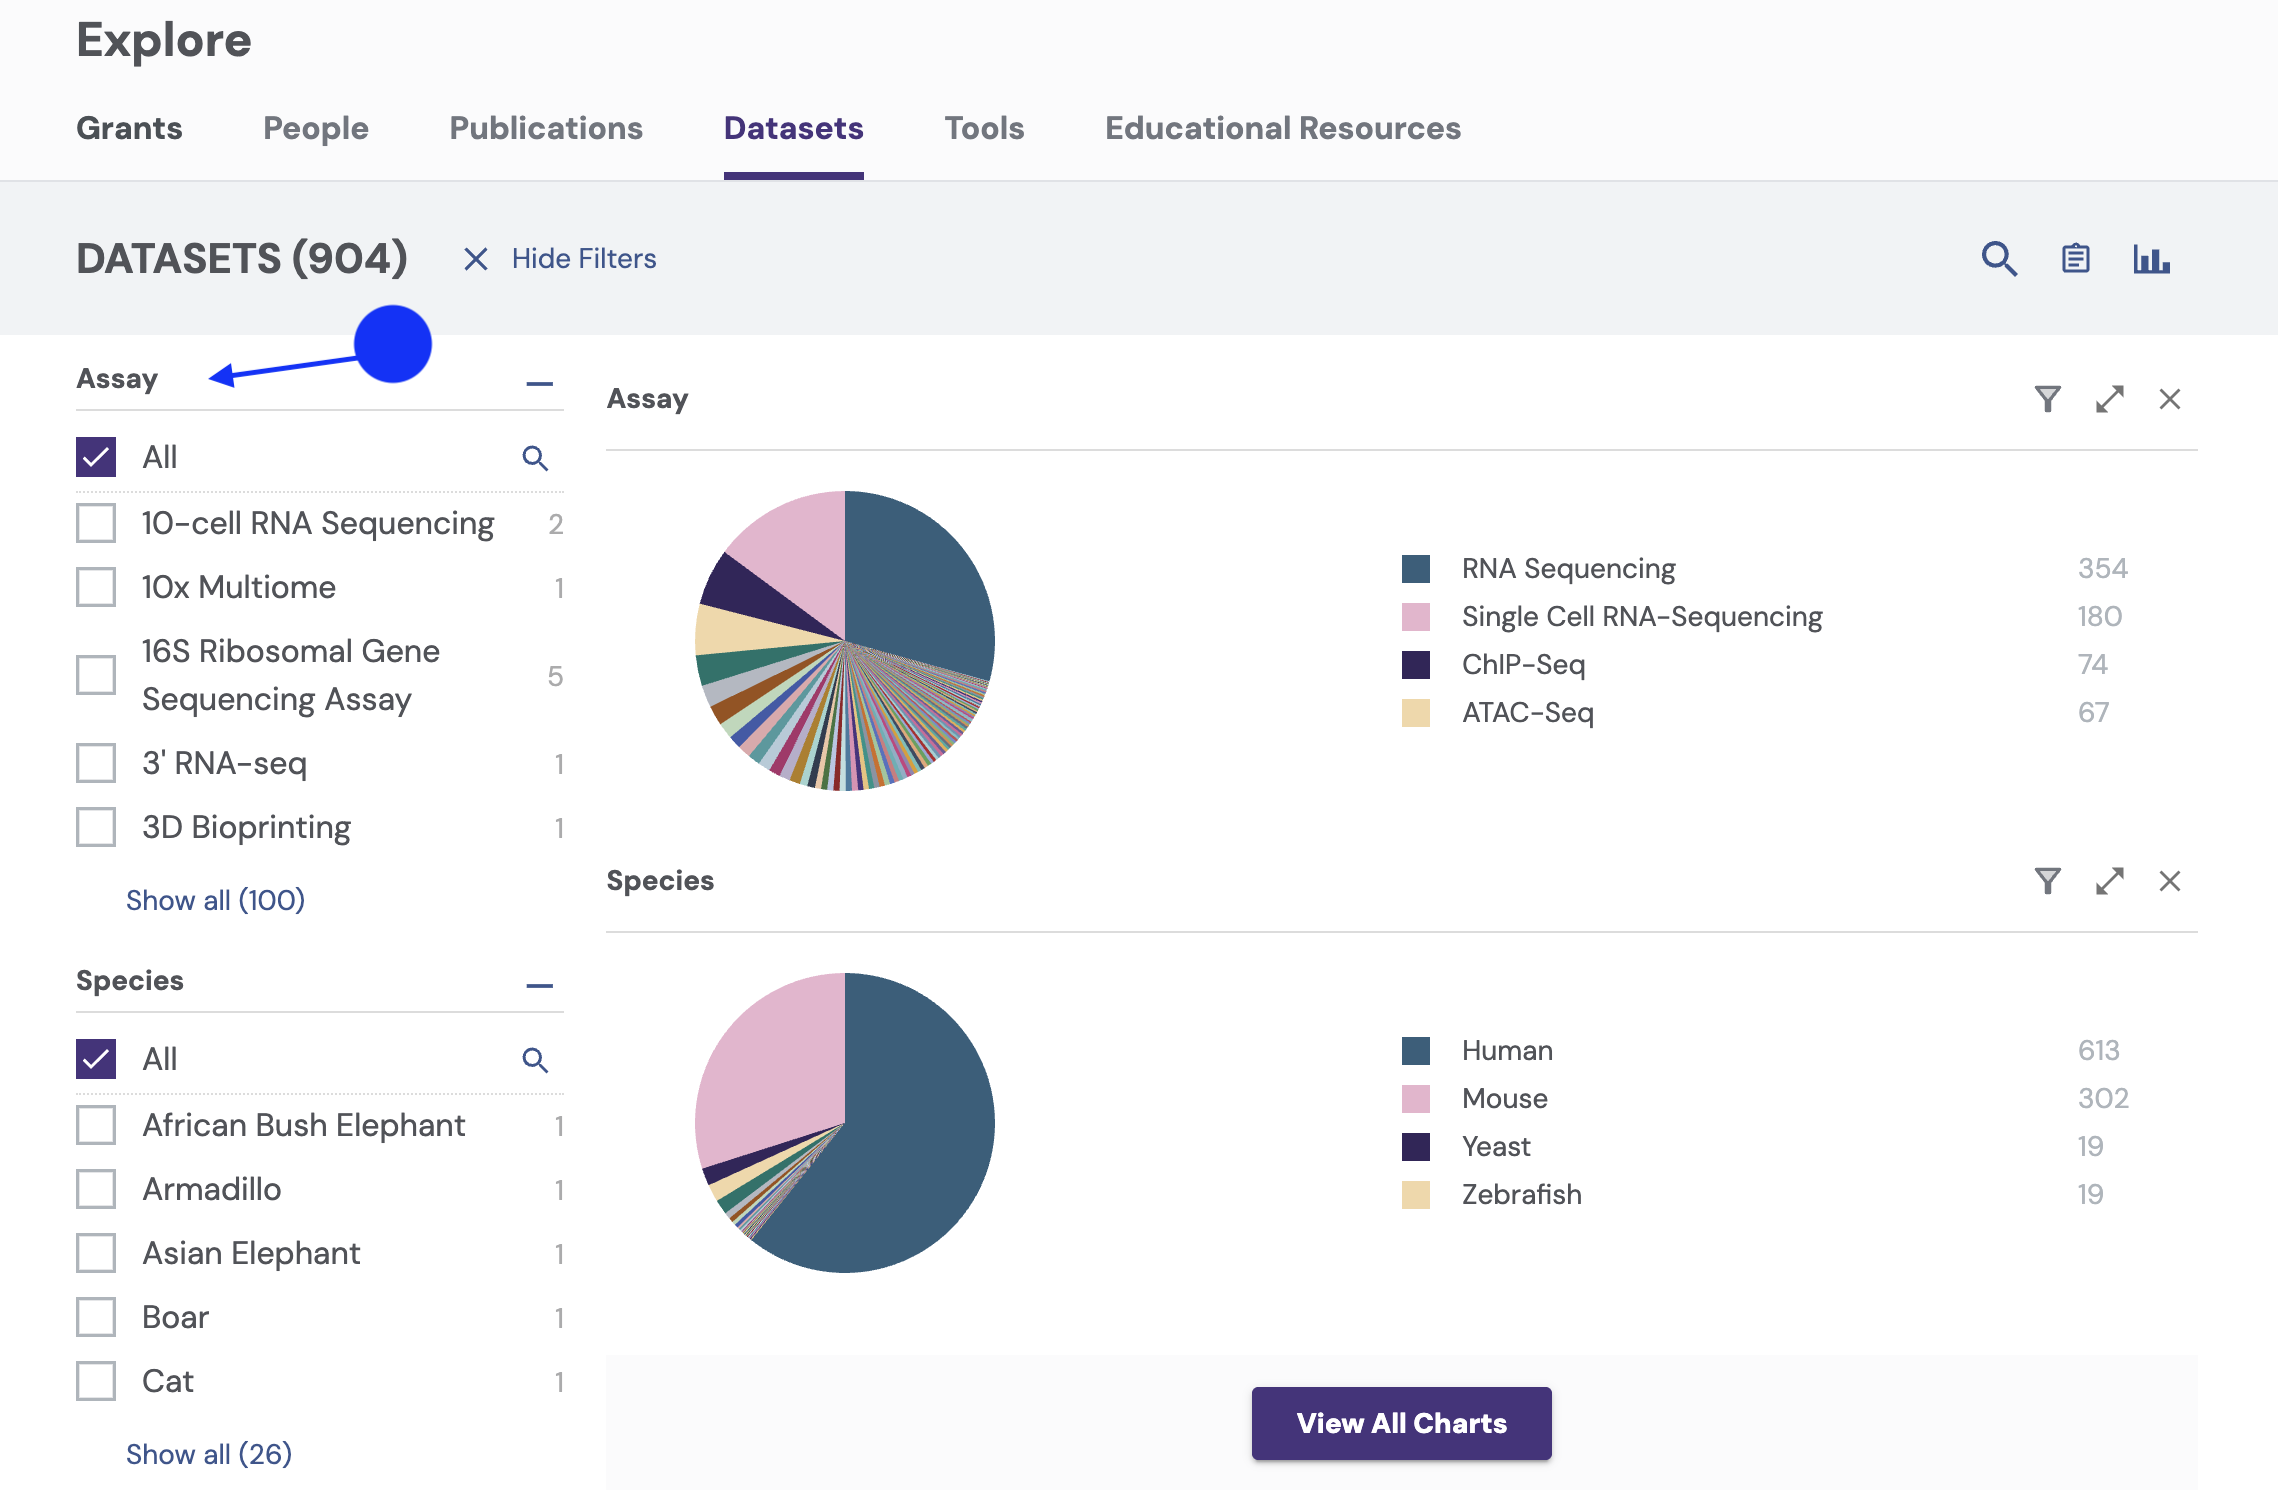
Scroll down for additional filters.
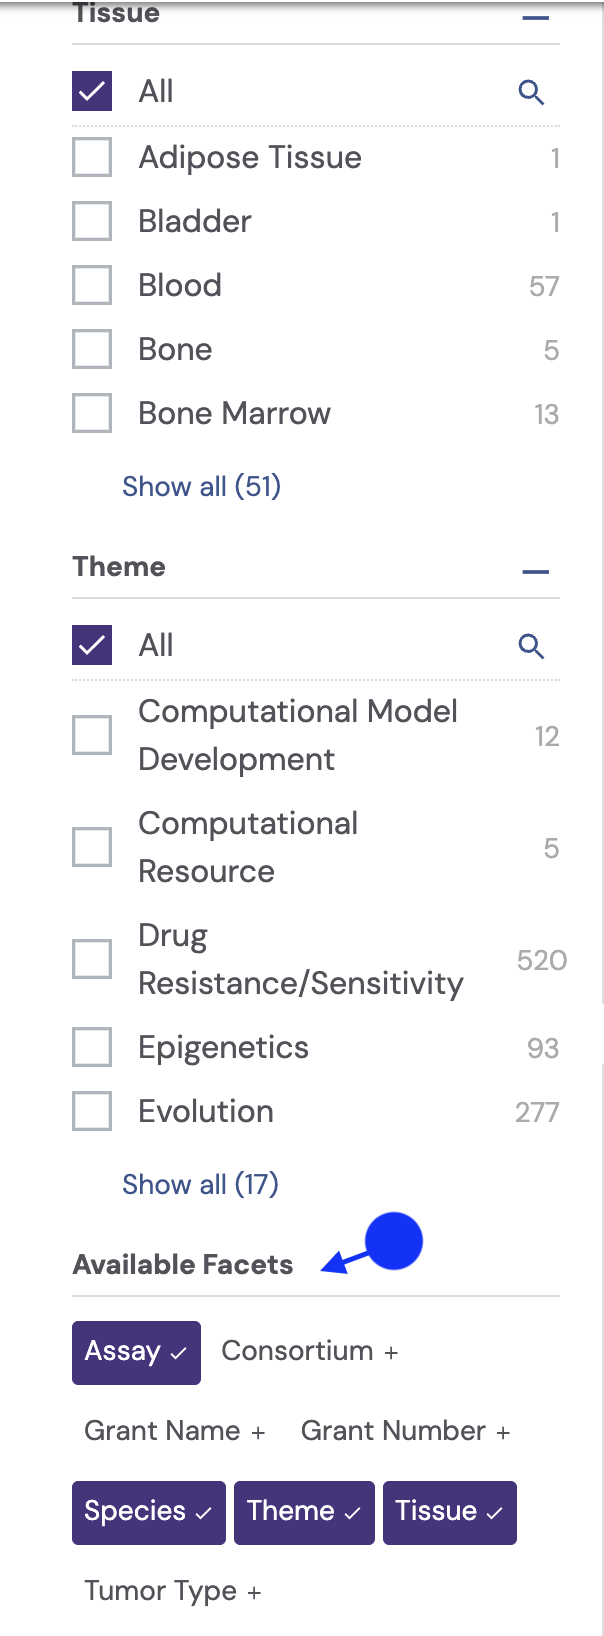
Select the desired filter, such as “Theme.”
Choose the desired option(s) from the list.
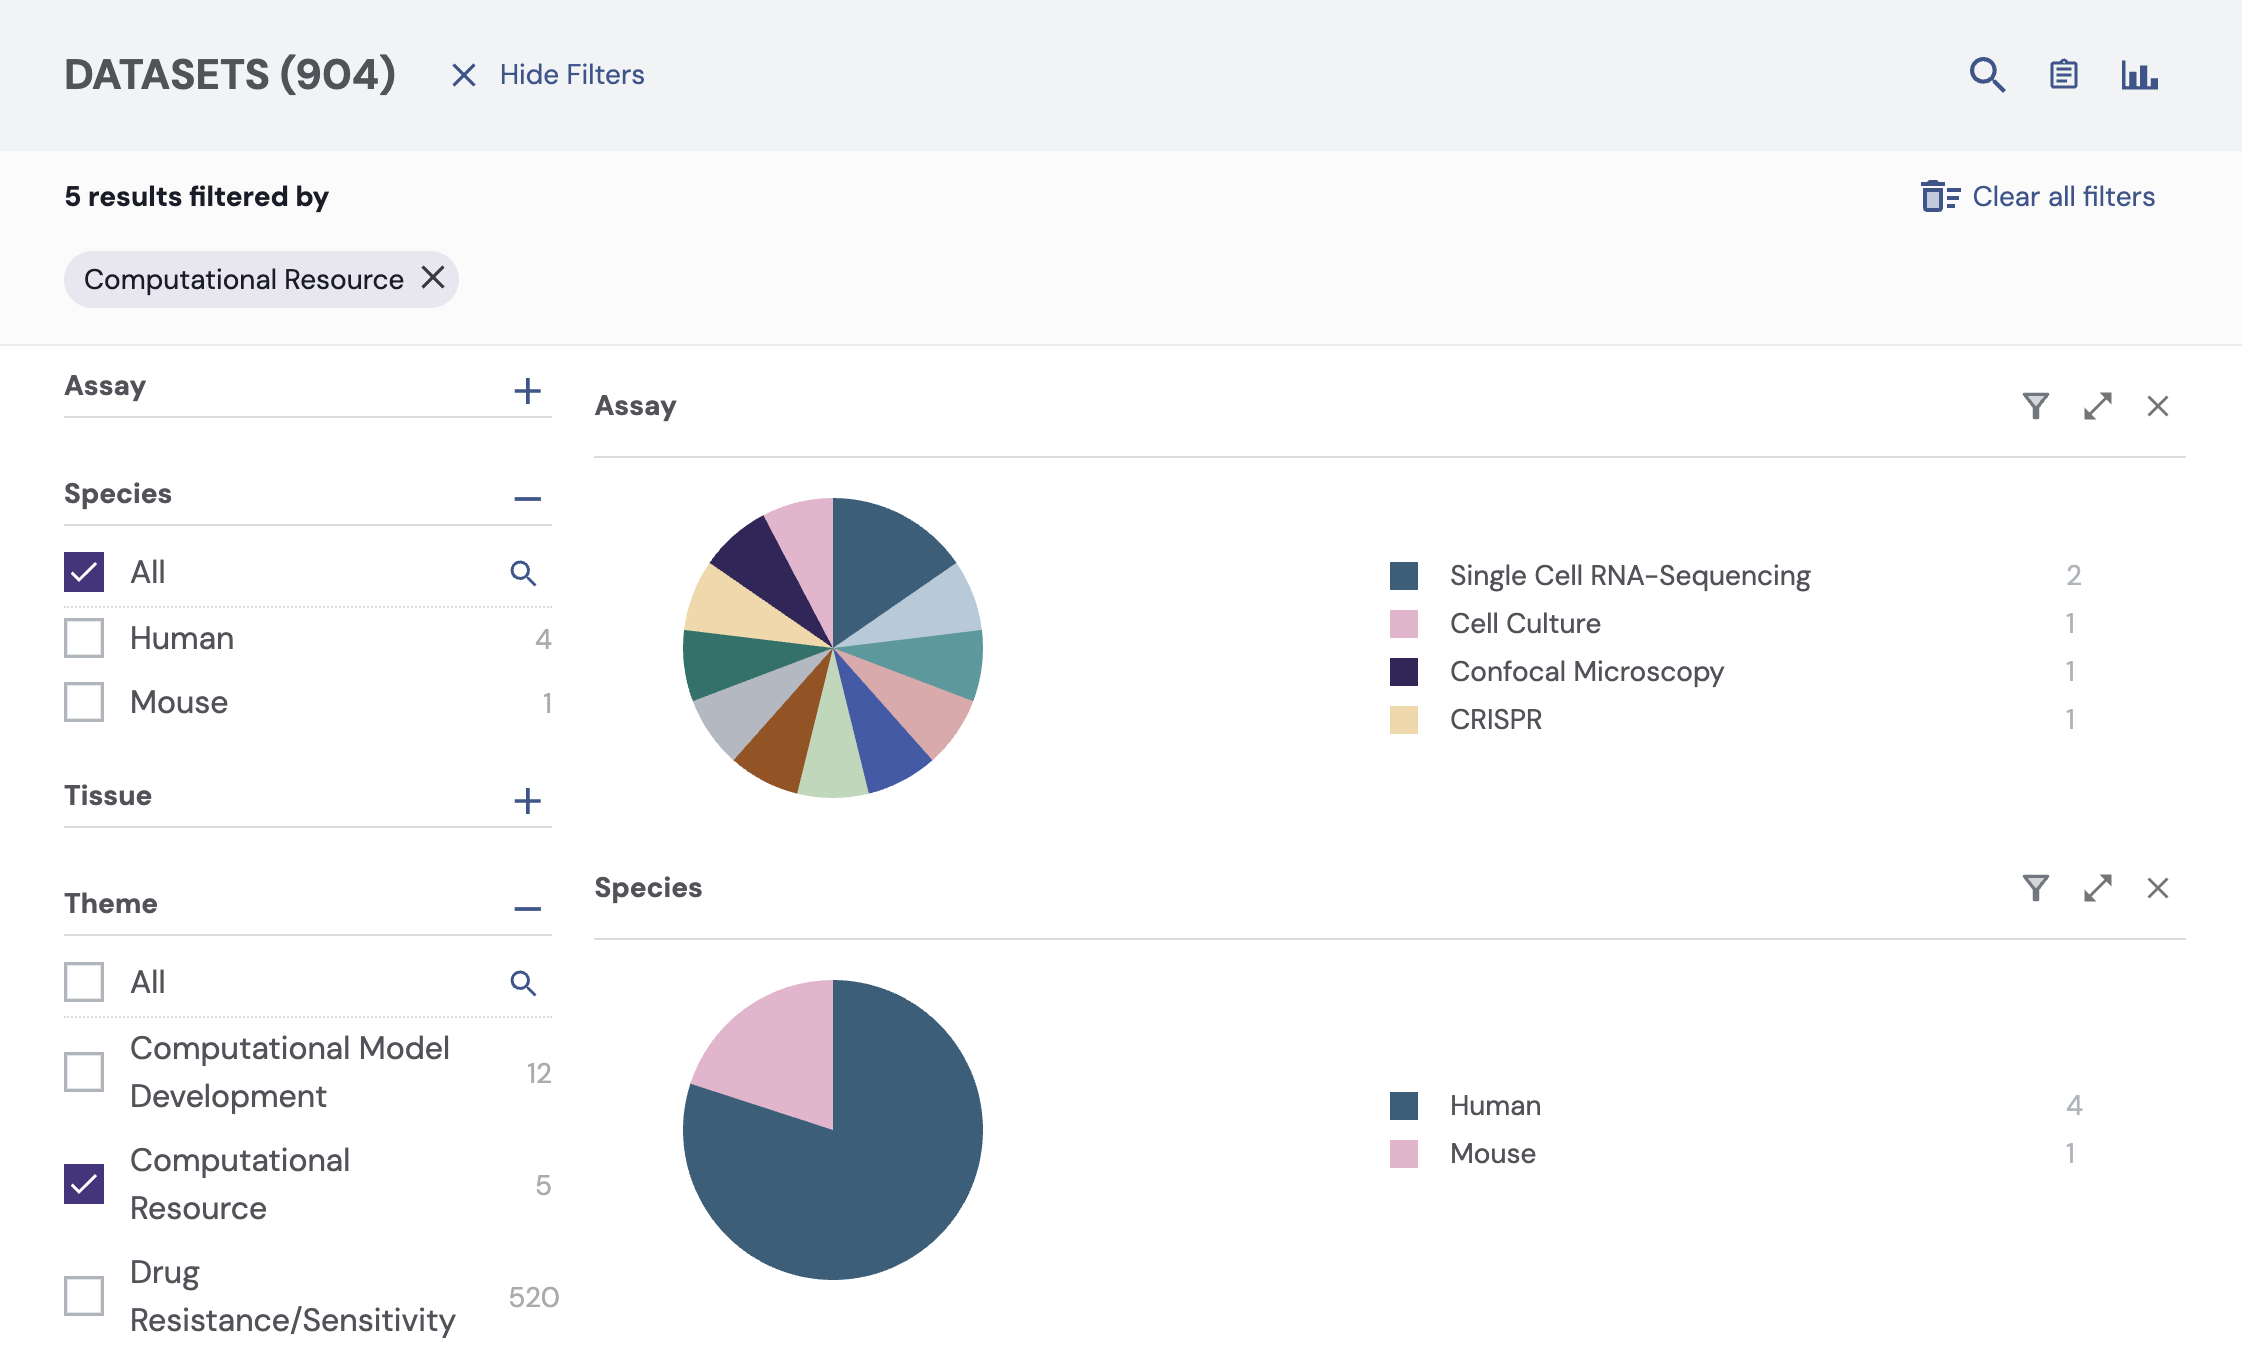
Results update automatically.
Selected filters appear in the top-left corner of the results panel.
To remove a filter, click its “X”.
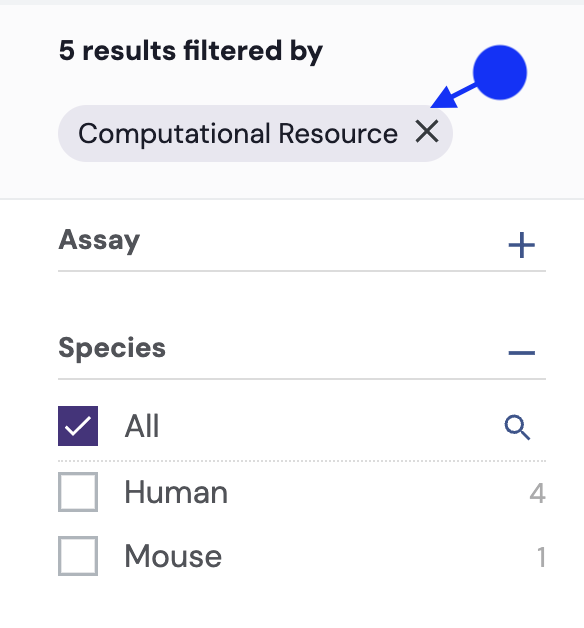
Filter Tools Example
Navigate to the Tools module.
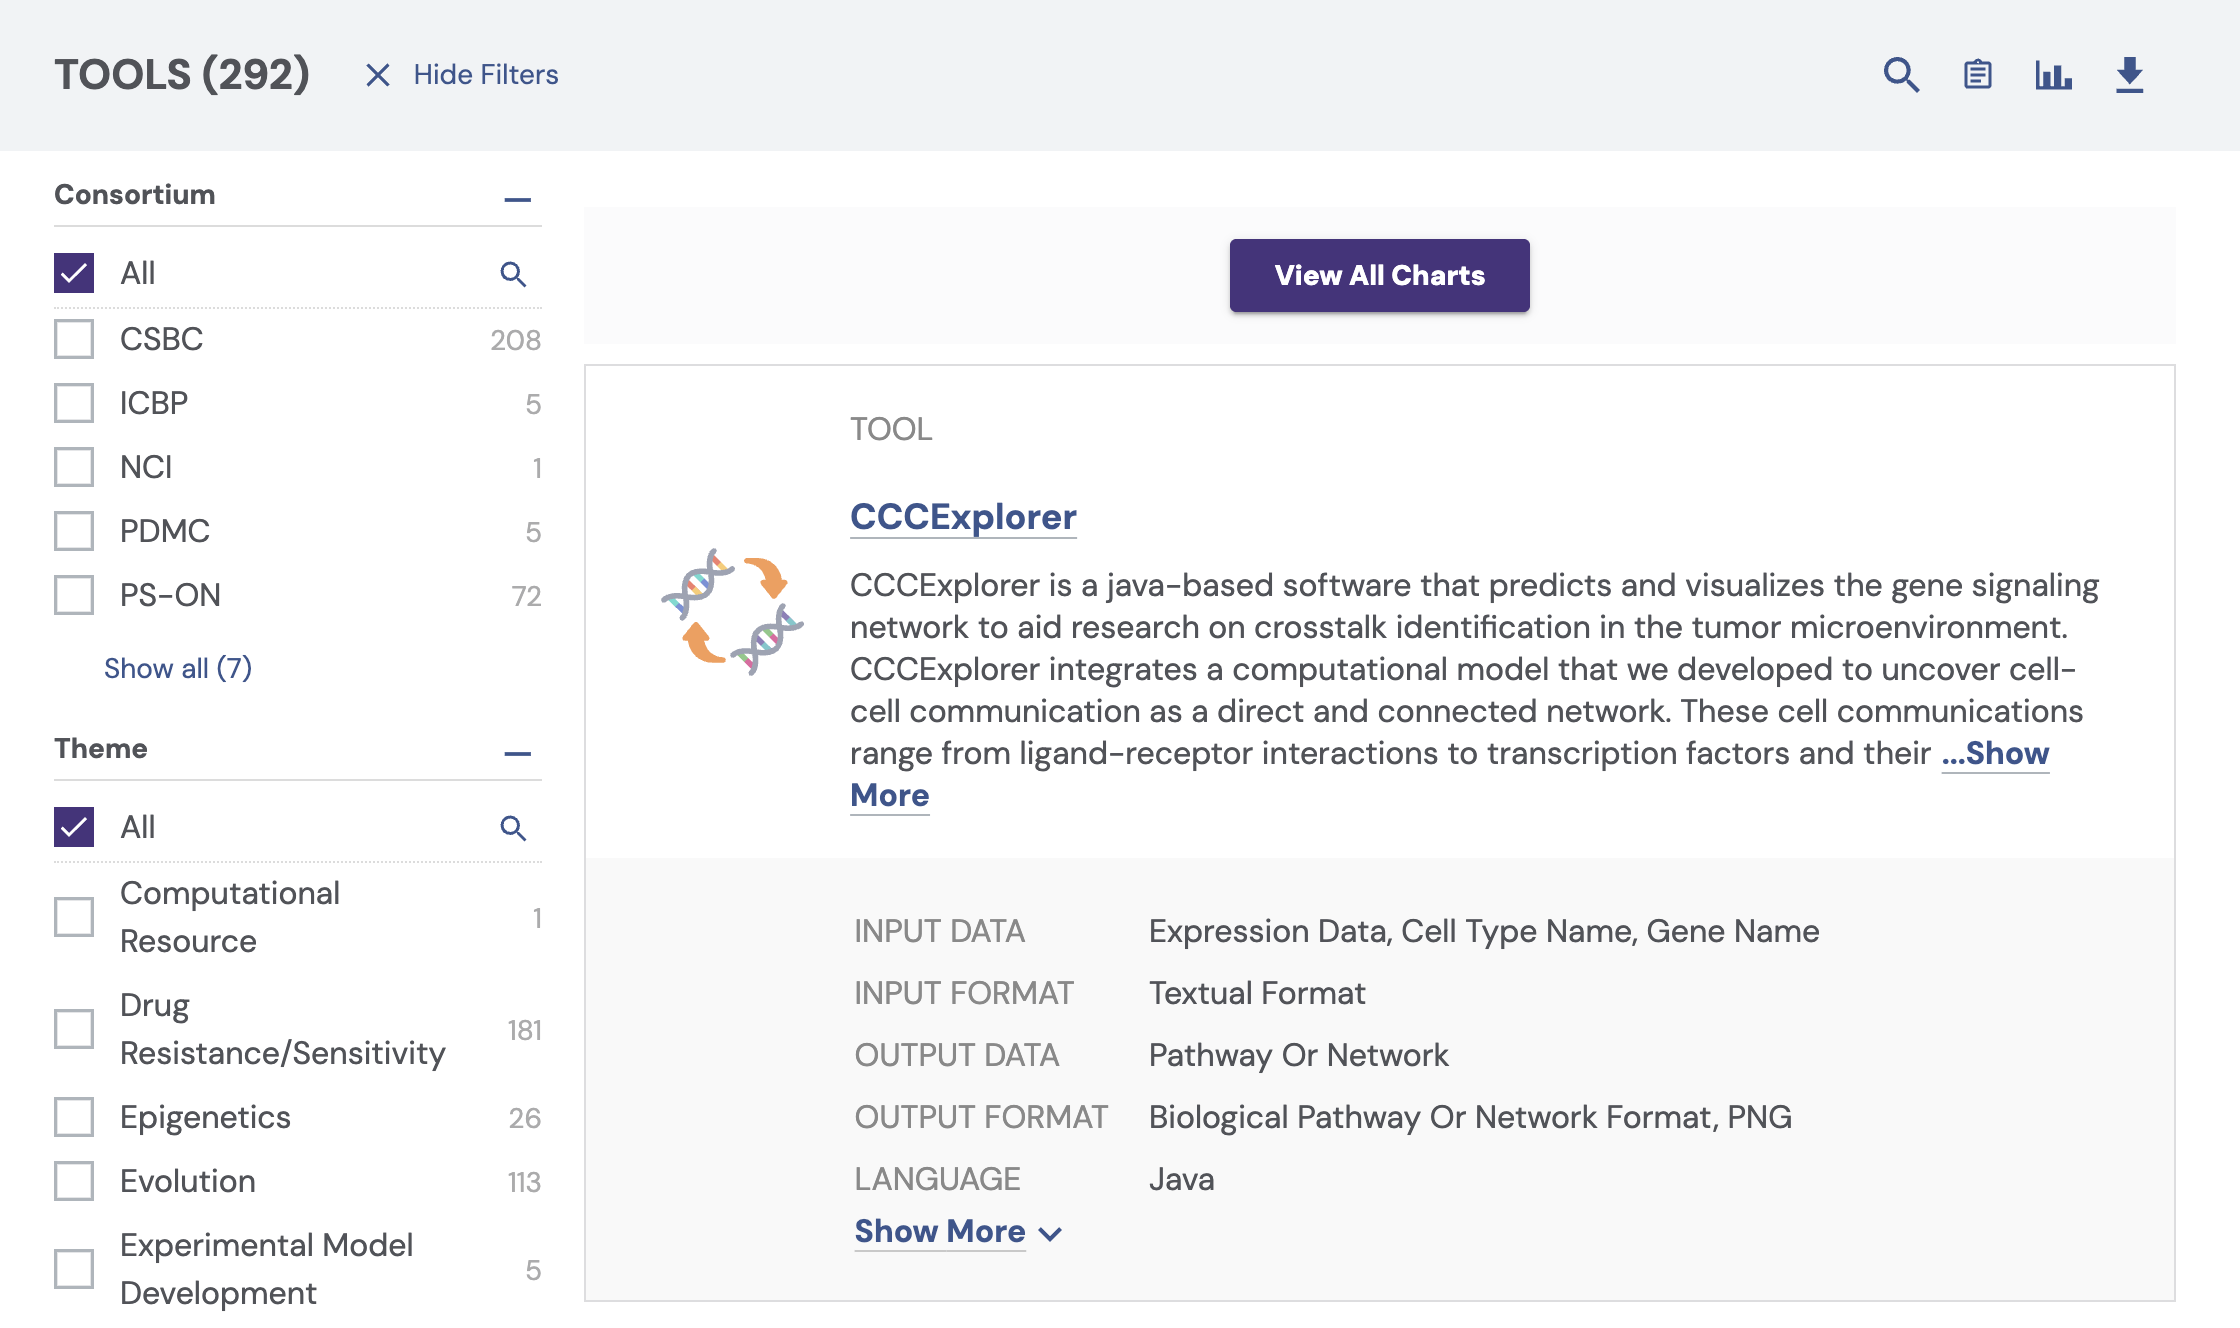
Scroll down and select desired filters based on your needs.
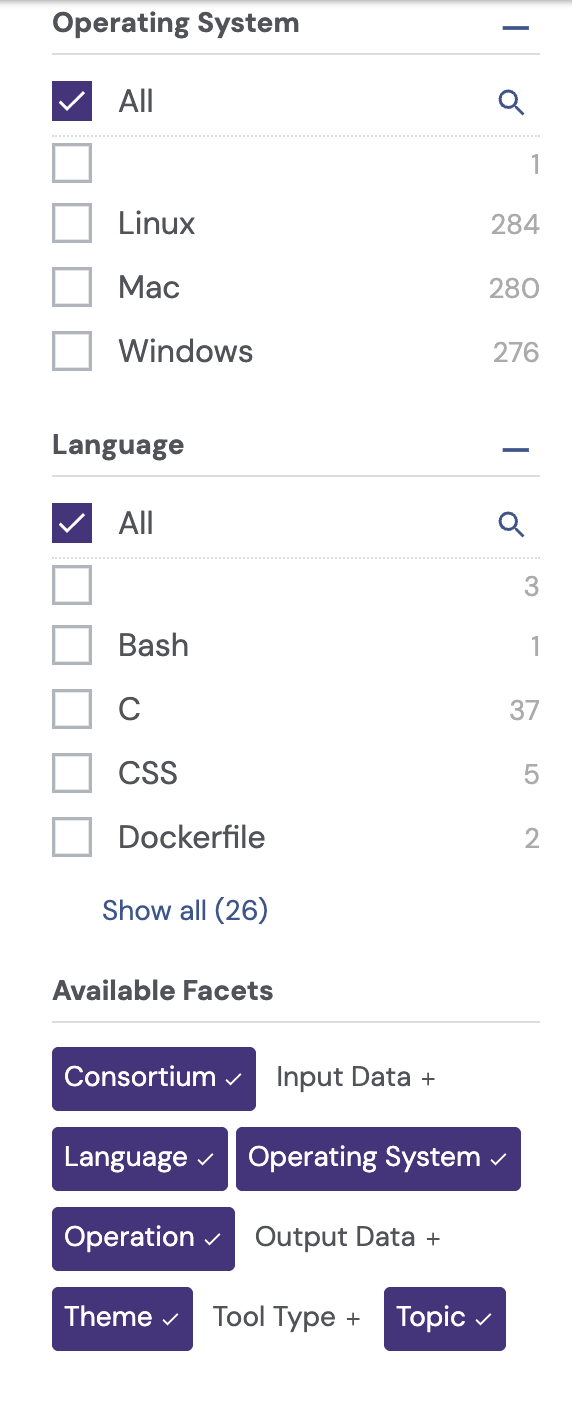
Toggle the options including Themes, OS, and Languages (1).
For a full reset of filters, click “Clear all filters” (2).
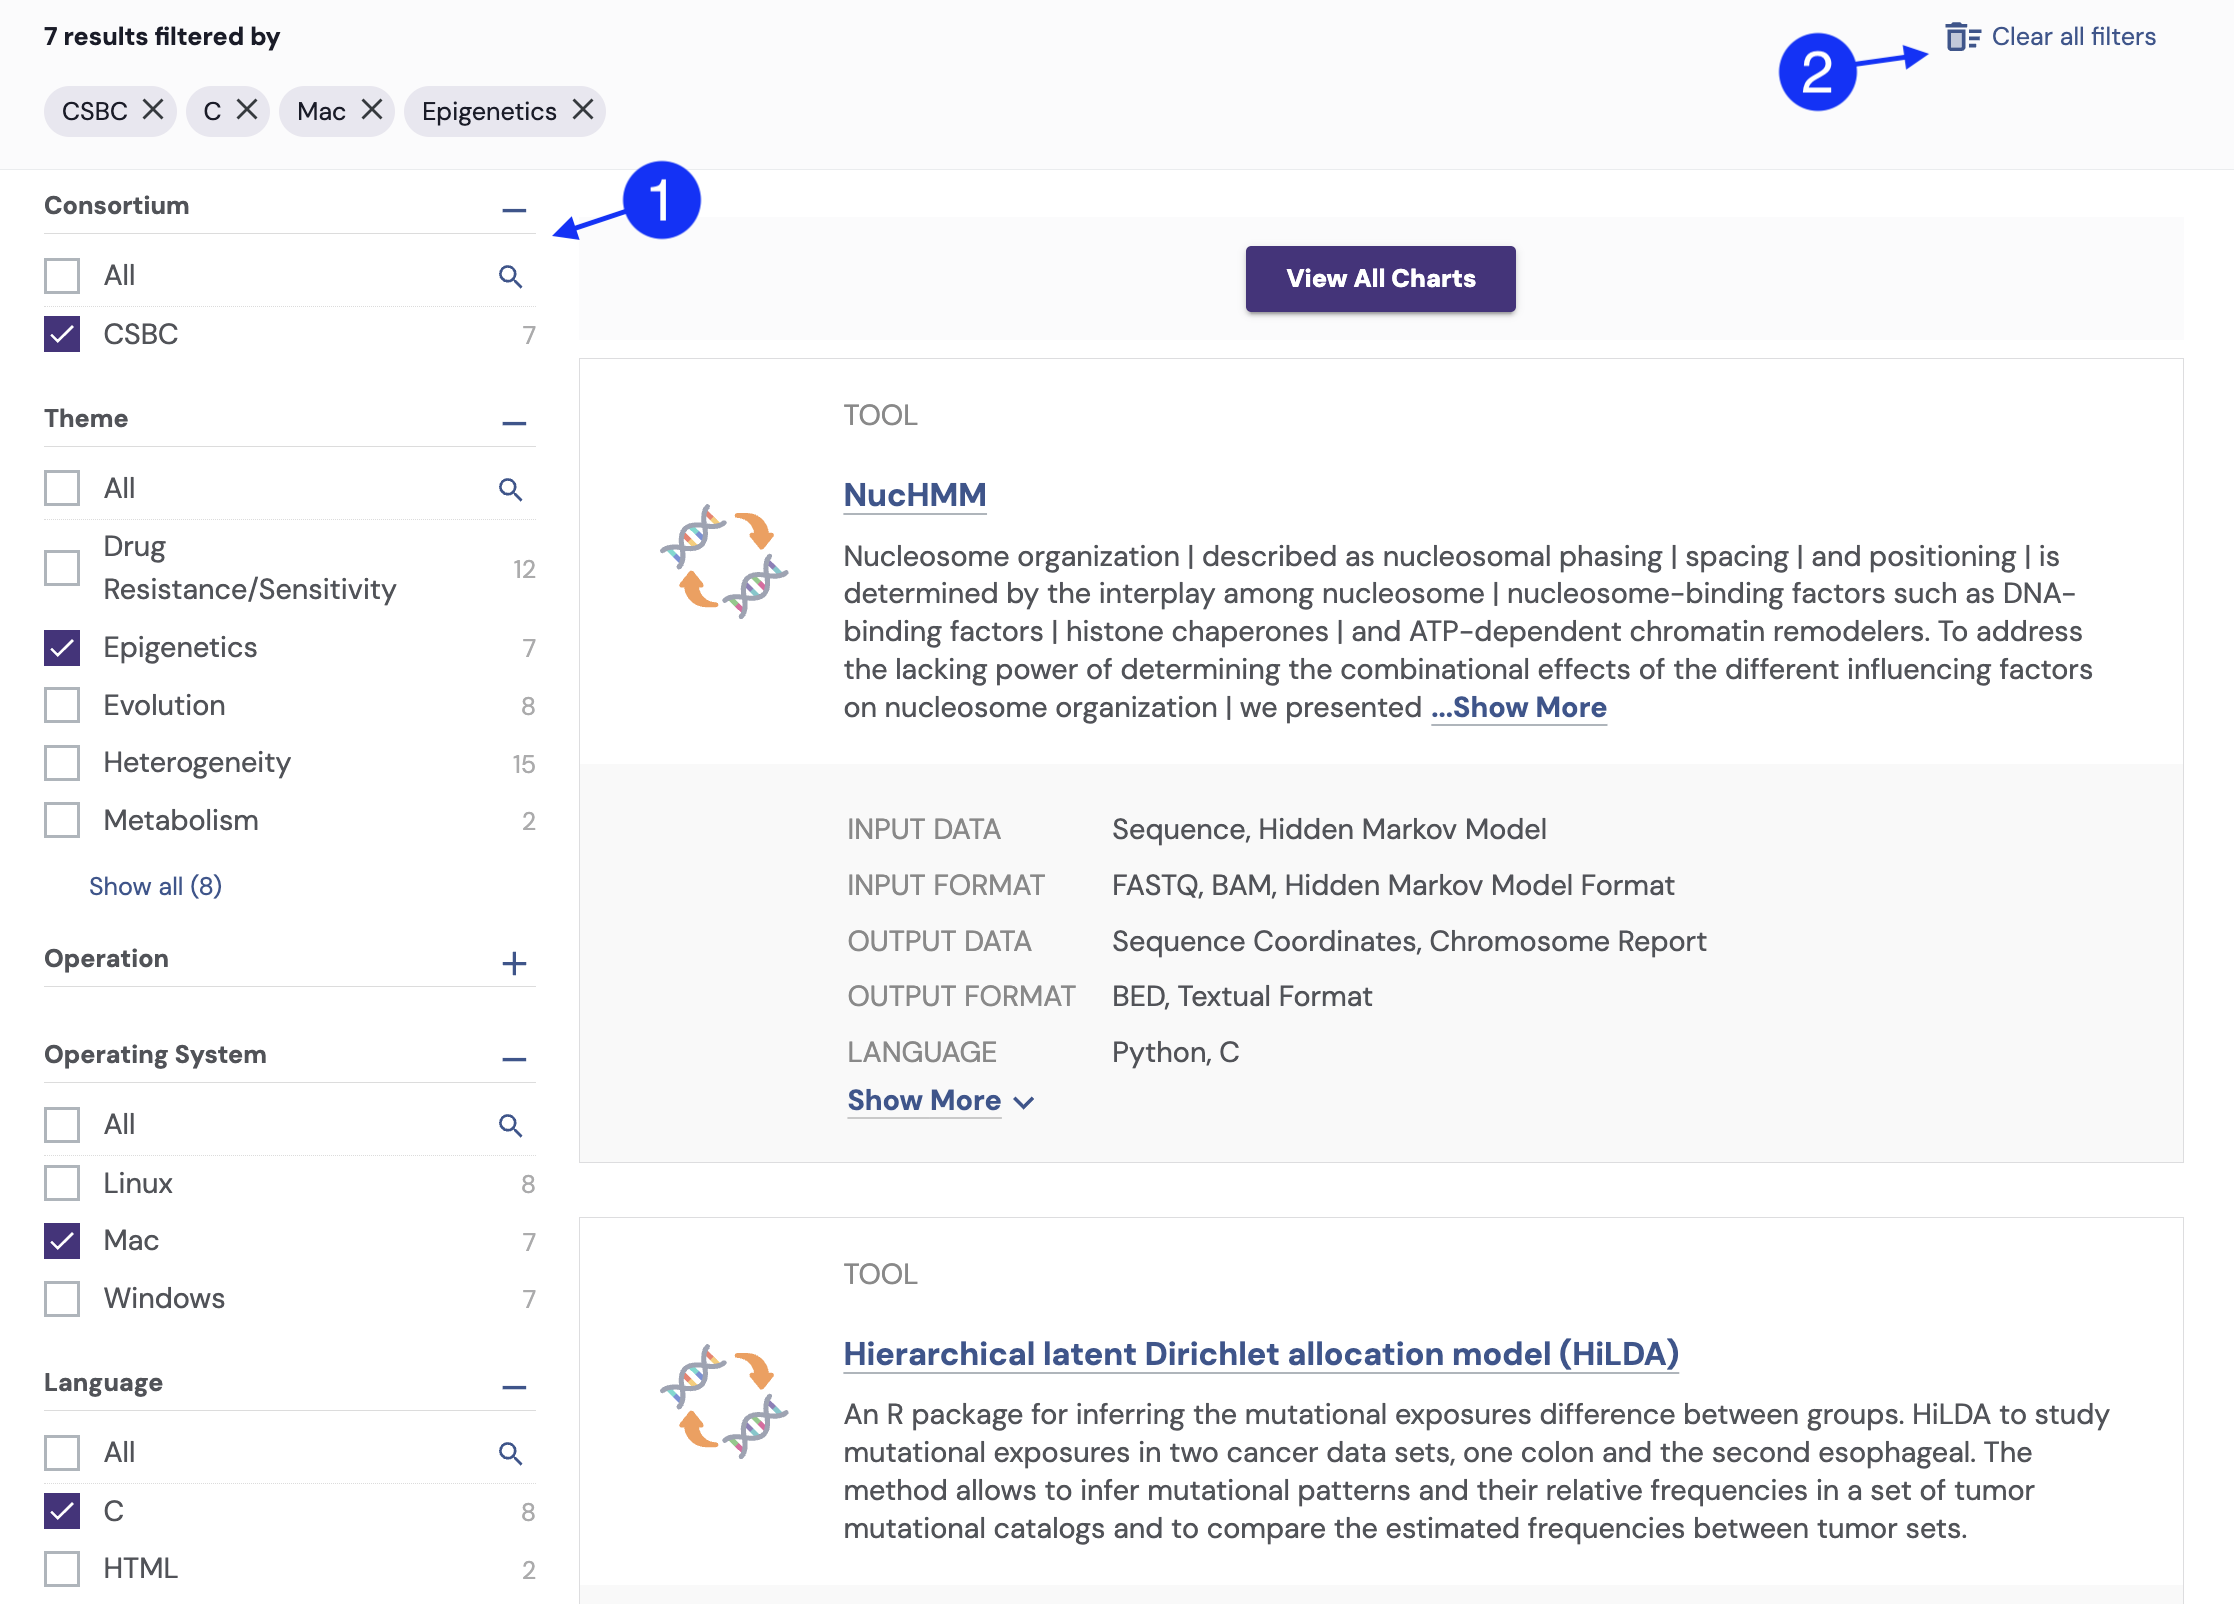
Tools that meet your specifications update in real time, allowing for a highly focused exploration of tools that may support your research.
Category-Specific Filters
Research categories include specific filters. Category-specific filters include:
Grants
People
Publications
Datasets
Tools
Educational Resources
Charts
Charts provide an interactive way to visualize resources available on the Portal. You may select resources by clicking on the pie charts. Charts can also be used to visualize research data to support trend and distribution analysis. They provide insights into grants, datasets, publications, and tools.
Accessing Charts:
Click a section of the pie chart to filter results.
Interacting with Charts:
Hover over chart elements to see detailed values.
Click on chart sections to filter results.
To reset selections, click the (X) button in the visualization panel or use the "Clear All Filters" option.
See how to narrow your search in seconds with this short demo of our interactive chart filters.
Learn how to download data for offline use in Download CCKP Information.
